Gantt Chart: A chart that displays the schedule of a project combined with activity length, critical paths, dependences, deadlines, and more.
The History of Gantt Charts
The first “gantt” chart was created by a guy named Karol Adamiecki in 1896 who referred to it as a “harmonogram”, but he received little credit since his work was done in the Polish language. Poor guy.
The Gantt that you think of when you think of Gantt charts is actually named after it’s creator, Henry Gantt. Mr. Gantt created his version in the 1910’s – 1910-1915 to be exact. So the gantt chart is a hundred flippin’ years. Who would’ve thought?
In the past, Gantt charts were created by hand. Thankfully this is no longer the case as software programs can do almost all of the work for you. We’ll discuss below how you can create one using project management software like Wrike and MS Project.
How to Read a Gantt Chart
If you’ve watched someone present a project before, you may have already seen a Gantt chart. Gantt charts sum up the project activities, critical path, schedule, schedule dependencies, slack, deadlines, and progress in an easy to understand graphic. Software programs create these automatically based on activity input.
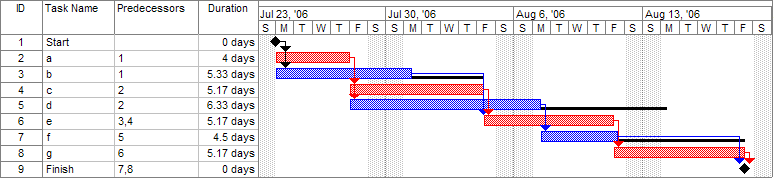
Figure 1: An example Gantt Chart Made Using Microsoft Project Management Software. Credit Wikimedia
You may be wondering what these bars and lines mean. Here’s a quick key to what the elements in figure one convey:
- Each bar represents an activity within the project.
- The red bars display the critical path
- The blue bars display noncritical path items
- The diamonds mark a milestone
- The black solid lines show available slack
- The arrows show dependencies between activities.
There are also other formats for Gantt Charts. For example, a gantt chart from the software program wrike looks like this:
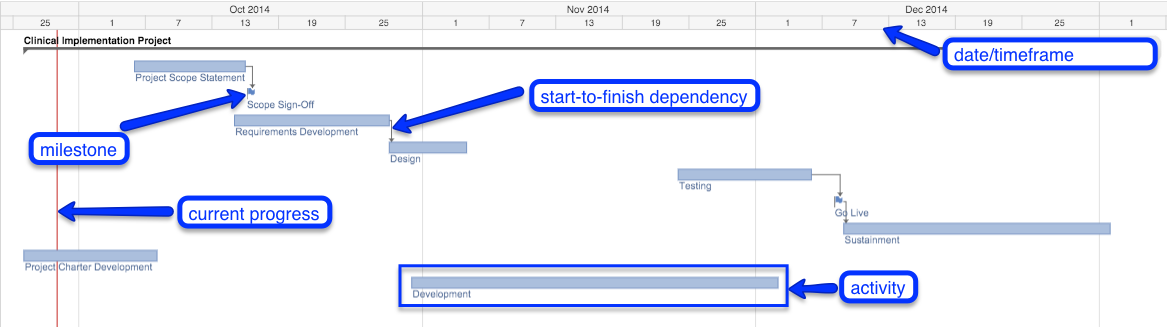
Figure 2: A Wrike Created Gantt Chart
As you can see, many of the elements are very similar.
Why Use a Gantt Chart
You should use a Gantt chart when you need to explain the schedule quickly to those familiar or unfamiliar with the project. Gantt charts are particularly useful for presenting to busy executives who need an update on the progress and the remaining work on a project. They are also useful for those familiar with the project. Expanded and detailed charts with every WBS element can be helpful for program managers, master schedulers, risk managers, and the like.
Gantt charts provide the following benefits to project managers and others who need to understand ongoing projects.
- Understand the most important schedule information in a glance
- Quickly see dependencies, milestones, and activity durations
- Determine current progress and remaining activities
- See which activities are on the critical path
- Draw attention to future activities that may not be on the radar yet
Gantt charts may be used in other applications such as scheduling employee work times and off-duty times to ensure coverage during all working hours.
When Not to Use a Gantt Chart
Gantt charts are not always appropriate. In particular, they may be unwieldy when dealing with an extremely large or long project whose diagram is difficult to print or when the project has so many dependencies between projects that the chart would become difficult to read. As a rule-of-thumb, you may want to consider other options if you have to squint to see activities or use your finger to follow dependencies throughout the chart.
How to Create a Gantt Chart
Unfortunately Microsoft has yet to create a version of Microsoft Project for mac, but don’t worry, if you’re not using a Windows machine, there are still other options. We like the free project management software Wrike for building Gantt charts. Wrike offers a simple, more team-friendly solution to project management. In it, the process for creating the chart is pretty straightforward.
If you choose not to use Wrike and prefer MS Project, MS Project automatically creates the chart for you under the “Gantt Chart” view – you just may want to reformat it cause like a lot of their stuff, it’s default state isn’t very purdy.
In most project management software, the process to create a Gantt chart is as follows:
- Create and organize your activities using the Work Breakdown Structure (WBS) to show related activities.
- Set durations and dates for each activity. Remember that milestones have a duration of zero.
- Add dependencies between activities. Dependencies occur when a task can only start when another task finishes (FS dependency), a task must finish at the same time another task finishes (FF dependency), a task must start at the same time another task starts (SS dependency), or a task cannot finish until another starts (SF dependency).
- Some project programs may want to move activities if dependencies conflict one another. The decision to accept these changes is up to the project manager and depends on the specific project.
- Select the Gantt Chart view to see the chart.
And voila, you have a Gantt Chart.
Iterations on the Gantt Chart
While Gantt charts can provide a quick overview of a project’s schedule, it cannot provide a deep analysis of project and likely and possible activity durations. For this, you’ll need to do a PERT (Program Evaluation and Review Technique) analysis. PERT analyzes tasks by assigning an optimistic, pessimistic, and realistic duration for each activity. Using this information, a project manager will create an AOA (Activity on Arrow) or AON (Activity on Node) diagram which includes every activity and it’s:
- Latest Possible Start (LS)
- Latest Possible Finish (LF)
- Earliest Possible Start (ES)
- Earliest Possible Finish (EF)
- Slack associated with the activity
These calculations result in a chart that looks like this:
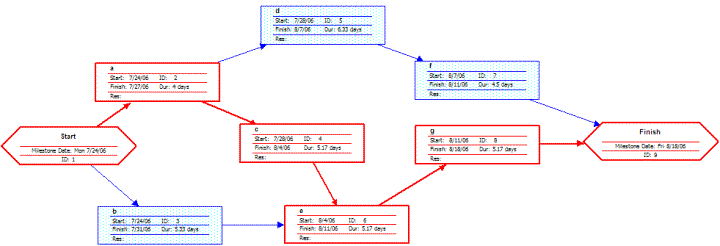
Figure 3. An AON PERT Analysis Chart via Wikimedia
PERT analysis can be done by hand for small projects. Similar to a Gantt chart, many software programs can calculate this information for you.
More Resources
For more information on Gantt Charts, check out the following resources:
If you liked this post and got something out of it, we’d really appreciate it if you took a quick ten seconds to click on the share buttons below!